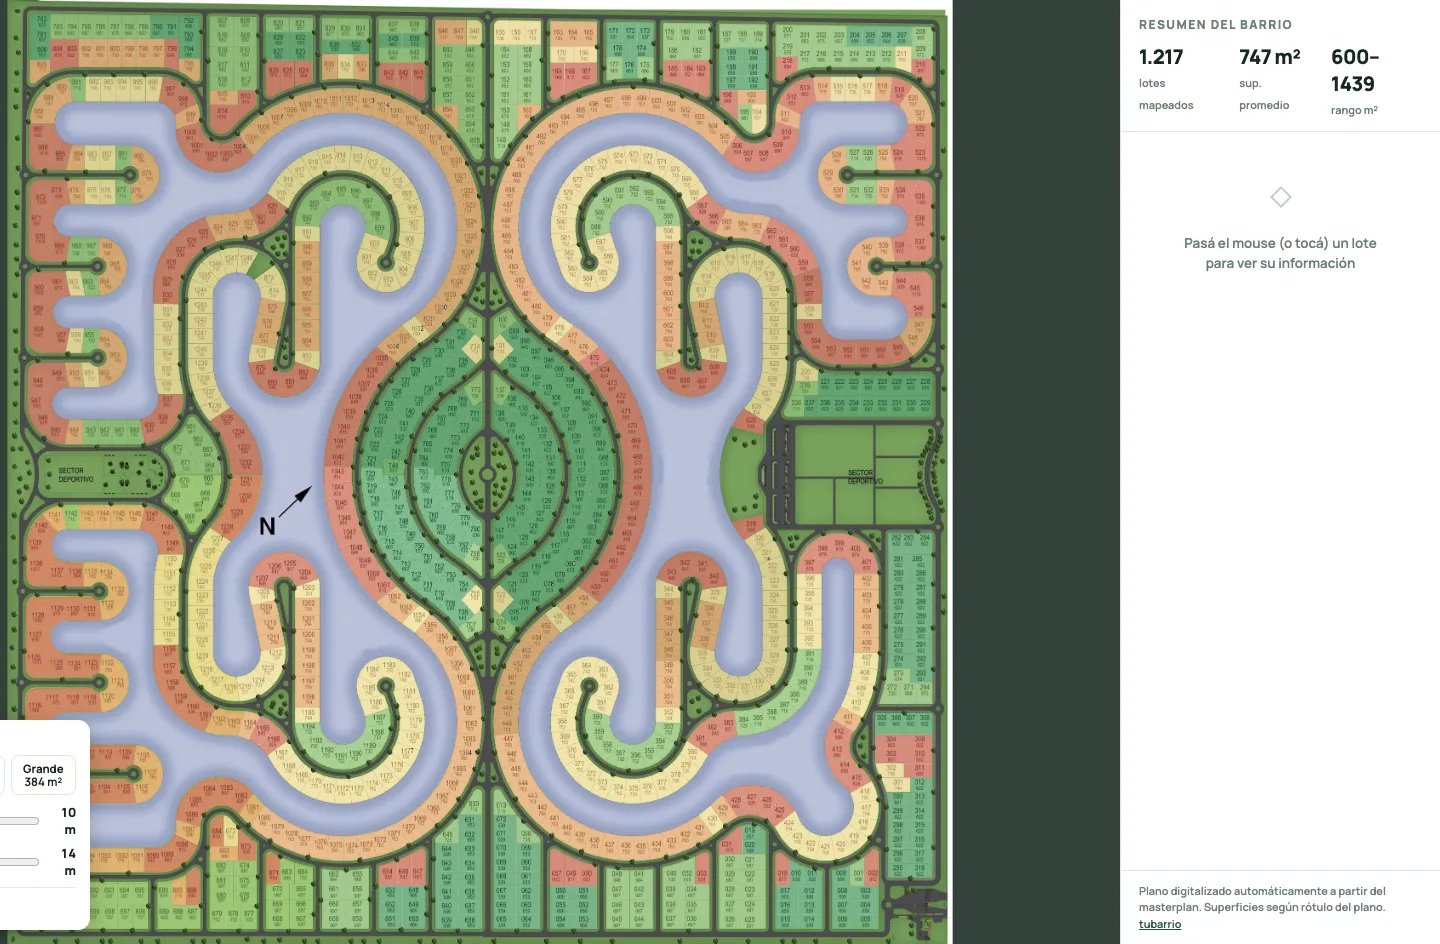
This is a JPEG. 8,885 by 8,872 pixels of green lots, blue lagoons and tiny printed numbers. It's how Santa Clara al Sur, a gated community south of Buenos Aires, sells its land. We own one of those lots.
You can't search a JPEG. You can't ask it which lots face the water, how big lot 744 really is, or whether a two-bedroom house fits on it. Every lot is a number painted on a picture.
So I had my AI agents turn the picture into a map for tubarrio, my portal of Buenos Aires gated communities. Then I sent a second crew to prove the first one wrong.
How do you turn a masterplan image into an interactive lot map?
Colour finds the shapes. OCR (software that reads printed text off an image) reads the numbers. A separate pass refuses to sign off until every number is accounted for.
The shapes are the easy half. Lots are filled light green, so a colour filter lifts out each blob. Stroke width sorts the ink: boundary lines are thin, digits medium, roads and trees fat.
The numbers are the hard half. Each lot carries two: its number and its area in square metres. Two very different readers took every lot: Tesseract, the open-source OCR engine, and a vision model reading one crop at a time.
The two readers agreed on 992 lots, so those counted as done for now. For 223 more, Claude looked at the crop and both answers and picked the right number. The last two lots were hiding in a single blob, glued together, so they were split apart and confirmed by eye. That makes 1,217.
That's the AI part. Fast, cheap, and the least impressive bit.
Why isn't "two AIs agree" proof?
Because two readers fed the same broken input will happily agree on the same wrong answer.
Mine did. An early version dimmed everything outside each lot's outline so each reader saw only its lot. Clean idea. Except the printed numbers overhang their lots, so the dimming shaved off edge digits. Both engines read the same clipped number, agreed perfectly, and were both wrong.
Two economists digitizing old bank balance sheets put it plainly: if OCR errors are "systematic and common across all engines, there would be no advantage to using more than a single one."
Agreement counts only when different engines look at the same honest pixels. Smaller lessons, same hard way:
- Tesseract confuses 7 with 1 on this font, systematically, and even with a digits-only whitelist it let other characters through, so non-digits get stripped afterwards.
- Grids of crops shift answers. Show a vision model a montage and it sometimes answers for the cell next door. One crop per call.
- Examples become hallucinations. One prompt said "like 057". The model started seeing 057 everywhere.
- Never hand-type a list. A hand-typed list of disputed lots once came out 48 ids wrong. Now an agent reads them from the file.
What does "zero errors" actually mean on a lot map?
Every number is accounted for: each appears exactly once, every missing number has a reason, and no lot pixel lacks a polygon.
The plan numbers lots from 1 to 1,248, which is 31 more than the 1,217 on the ground. A lazy check calls that 31 errors. A real check looks: numbers 240 to 270 don't exist, because the numbering hops over a sports area. Gap explained.
Then the panel. Ten fresh agents each got tiles of the original image, my machine-read labels stamped on top in red. One job: find a stamp that doesn't match the black print underneath. They made 1,242 checks and found zero mismatches.
Same rule I run on everything: the agent that did the work never grades it. Builders are optimists. Auditors get paid in mistakes.
What can you do with a lot map that a picture can't?
You can ask it questions. Type 744 and the map flies to it: 607 square metres on the plan, its four neighbours, and a price range labelled as an estimate, not a listing or an appraisal.
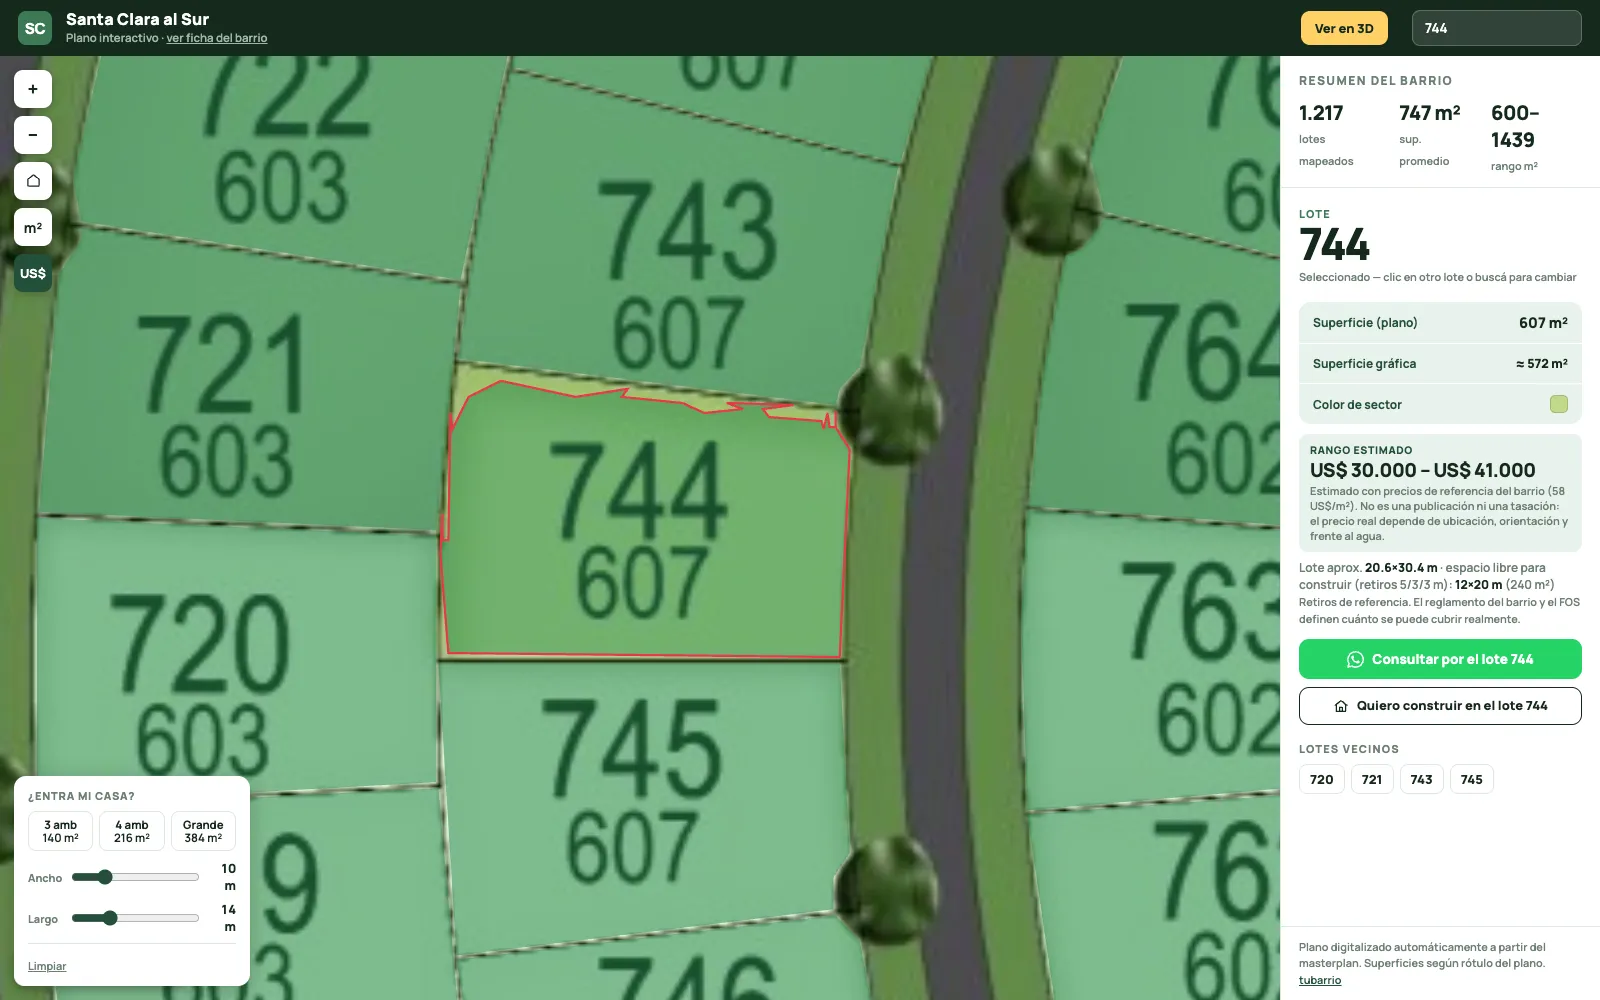
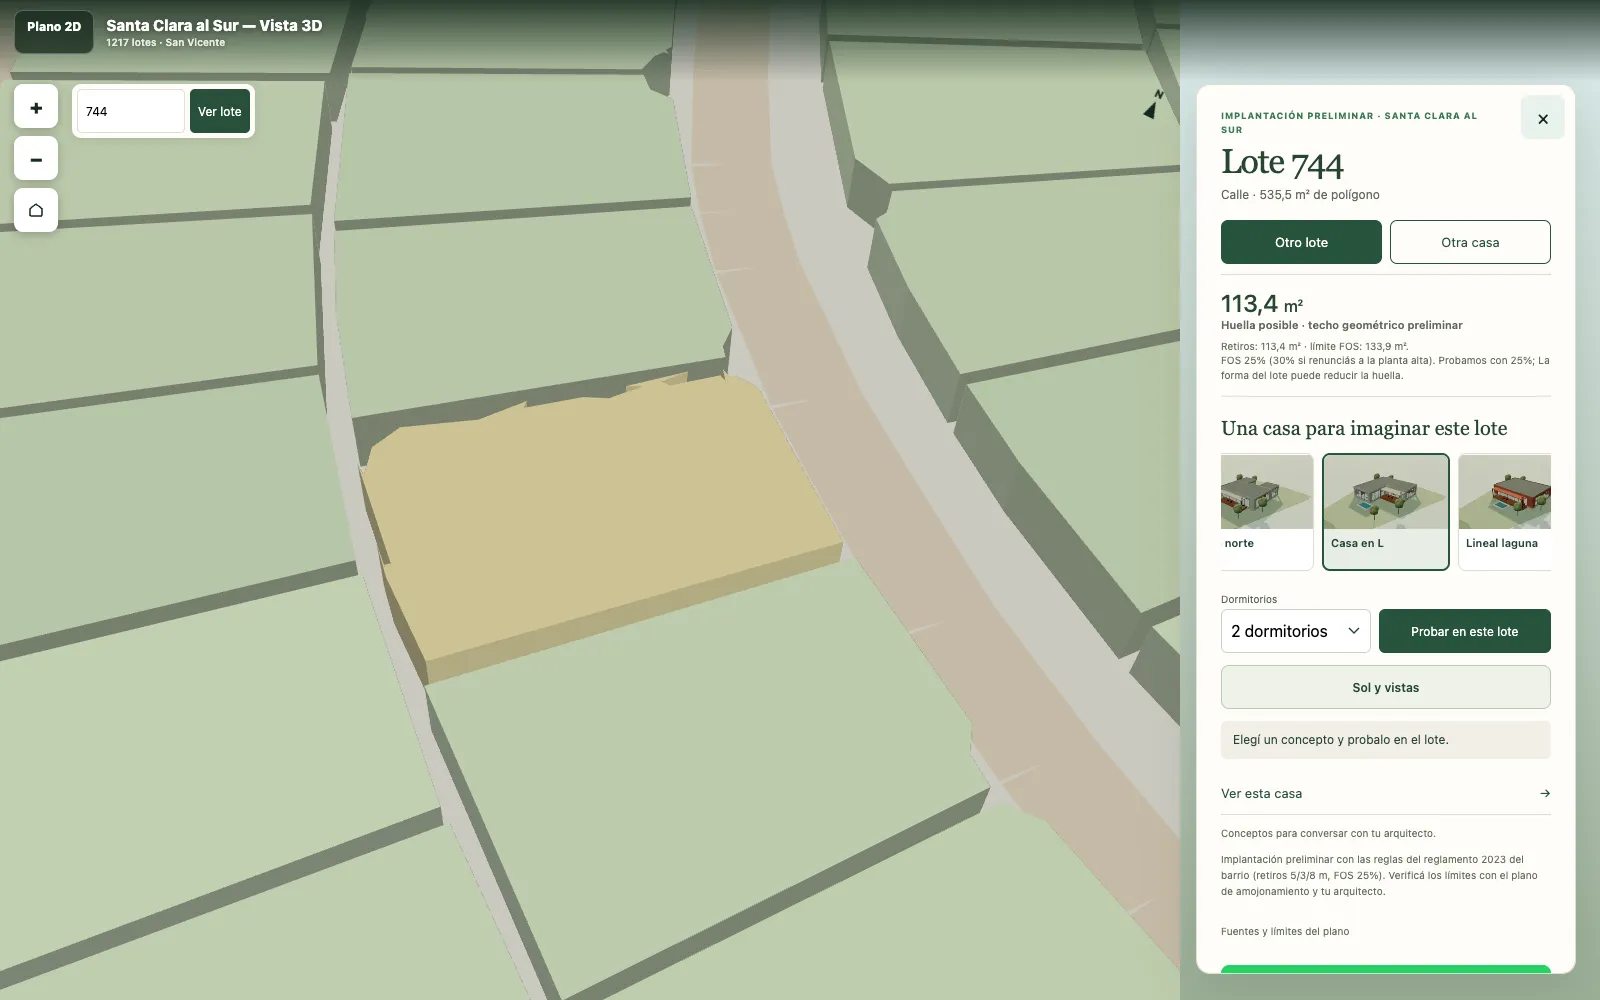
Because the lots are geometry, the building rules can run on them: 5 metres back from the street, 3 from the sides, 8 from the lagoon, a footprint of at most 25% (the FOS, in local planning speak). Nine house concepts try themselves on any lot; 1,084 of the 1,217 fit at least one. Talking points for your architect, not plans to build from.
An architect wanted it in CAD, so it exports a 3D model in real metres. Against the printed areas, the median error is 0.56%: fine for sizing up a house, not for surveying, and the export's readme says so.
That's the line between a demo and a tool: the tool tells you how far to trust it. (More on that bar in pixel-perfect design with AI agents.)
Can this work for every gated community?
Only where the ground truth exists, and the hard part is admitting where it doesn't.
Buenos Aires province keeps an official registry of gated communities (439 entries in the layer I pulled), and its cadastre (the official land-parcel register) holds real parcel polygons. So a second pipeline skips the JPEG and pulls official geometry, with one gate: a community ships only if the cadastre's lots match the registry's unit count.
Of 439, 63 passed. Two of those turned out to be one community, and the two masterplan builds bring the total to 64. The rest publish no lot-level geometry or fail the count, so no map. No guessing, no synthesized lots. Bonus comedy: the government servers reject foreign IPs, so the fetch runs from a Mac in Argentina.
When I wrote this, tubarrio showed 64 communities and 19,744 real lots in 2D and 3D. Its sibling for small businesses is a different trick: websites run over WhatsApp.
Where the registry falls short, the JPEG route still matters, and a second masterplan broke it anew: its numbers ran tilted along each lot's axis. On one of its stages, Tesseract read none of them. Rotate each crop by its polygon's angle and it read 404 of 535.
The AI read the picture. That part was cheap. The paranoia is what turned a JPEG into a map you can stand on.
Want AI agents that actually ship?
I build AI agents and the systems around them for businesses: memory, voice, overnight rigs, and the boring guards that make them safe to leave alone.
Questions people ask
Can AI read lot numbers from a masterplan image accurately?
Mostly, but not alone. On a 1,217-lot plan, two different OCR engines agreed on 992 lots; the rest needed an AI arbiter or a manual split. Accuracy came from verification, not from the readers: a closed number set plus a ten-agent panel that checked every label against the original image.
How long does it take to digitize a gated community masterplan?
The mechanical stages (finding the lot shapes, reading the numbers, reconciling the two readings) take a minute or two each on a Mac. Most of the effort goes into arbitration and QA, which scales with how many lots the engines disagree on and how messy the print is.
Is an AI-made lot map good enough for surveying?
No. Compared with the areas printed on the plan, the lot areas in the exported 3D model have a median error of 0.56%, which is fine for massing studies and buyer exploration. Boundaries for a sale or a build still need the official survey and an architect.
Where does official lot geometry for Buenos Aires gated communities come from?
From the province: a registry of gated communities and the provincial cadastre, which holds parcel polygons. Only some communities publish lot-level geometry. Of 439 registry entries, 63 had cadastre lots matching their registered unit count, which is the bar for building a map from them.
What is FOS on a gated community lot?
FOS (factor de ocupación del suelo) is the share of a lot a building's footprint may cover. In the community in this post it is 25%, or 30% if the owner gives up a second floor, on top of setbacks of 5 metres from the street, 3 from the sides and 8 from the lagoon.

Max Sergeev. Max builds AI agents and the systems around them: long-term memory, voice, overnight rigs, and the boring guards that make them safe to leave alone. He runs kilazi labs from Buenos Aires. kilazi.com
Sources
Read next
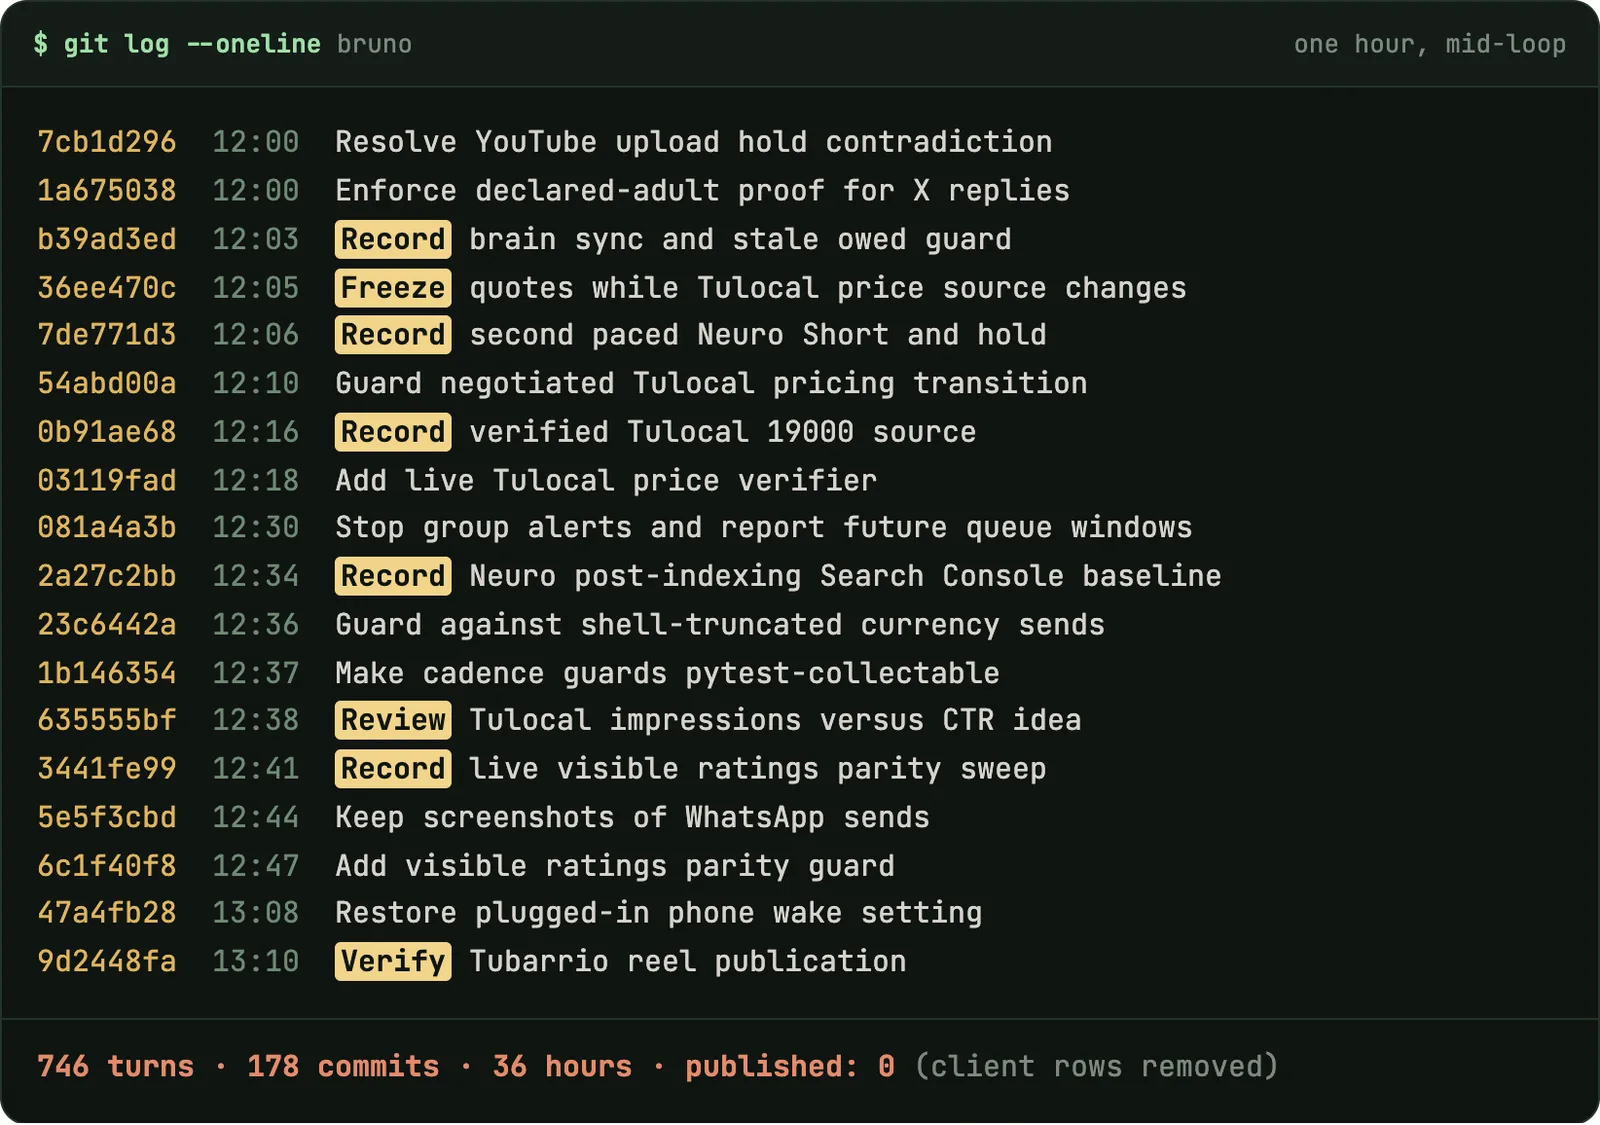 AI agentsMy AI Agents Need a QA Department (Bruno Checked Himself for 36 Hours)746 turns, 178 commits, nothing published. What goes wrong when agents grade their own homework, and the boring department that fixes it.Read it 2026
 ProductsA free website you manage by WhatsApp voice noteSmall businesses get a site for free. The admin panel is a chat. The loop, the rules, and the numbers that hurt.Read it 2026
 AI agentsAI Agents and Pixel-Perfect Design: 99.997% Match, Still WrongFigma diffs, screenshot passes and AI reviewers, all green. Then I opened the homepage and the arrow wasn't centred.Read it 2026